Consumption monitoring for energy audits
From field measurement to the breakdown into the three functional areas required by the ENEA Guidelines under UNI CEI EN 16247.
MID-certified meters, energy meters for steam, flow meters for natural gas and flow meters for compressed air; the AL300 gateway, cloud dashboards and data always to hand for the energy manager, the consultant writing the energy audit or the ISO 50001 management system.
An energy audit does not end with an estimate
The ENEA Guidelines for industrial energy audits under Italian Legislative Decree 102/2014 require the site’s consumption to be broken down by functional area, with that breakdown backed by real measurements and a monitoring plan covering the significant loads to set coverage percentages that depend on the audited site’s total consumption in TOE.
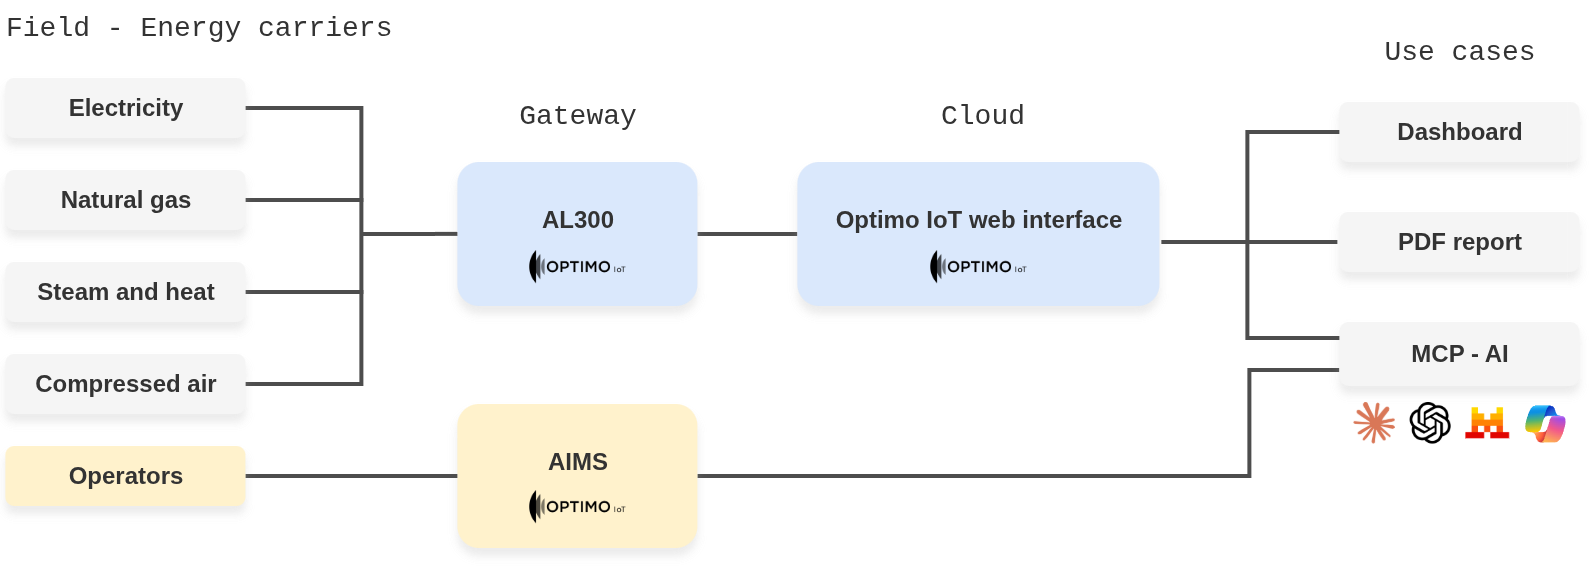
Optimo IoT builds the measurement system that makes this breakdown possible: certified instruments fitted on the site’s various energy loads (electricity, steam, compressed air, natural gas), the AL300 IoT gateway that collects the data on site, and a cloud platform where consumption is already aggregated into the categories the consultant needs. The result is continuous, verifiable data on cloud dashboards, available both for the audit in hand and for the next one.
The breakdown is documented
Every kWh attributed to a functional area corresponds to a physical measurement point, identified on the panel drawing and assigned to main activities, general services or auxiliary services.
Performance indicators can be calculated
Specific consumption per line, per department, per unit of product: that needs continuous data, not a two-week spot campaign.
Improvements become measurable
Without a measured baseline, the saving from an efficiency measure stays a forecast that nobody ever checks.
The next audit starts ready
The obligation is periodic. A continuous history removes the scramble for data every time the energy audit deadline comes round.
Three categories, defined during the audit and validated while the plant is running
The system is set up from the site survey onwards to break consumption down into the functional areas set out in the ENEA Guidelines.
1. Main activities
Consumption tied directly to the production process: furnaces, presses, shears and all the other machinery used directly in production.
2. Auxiliary services
Consumption from the auxiliary equipment serving the production process: air compressors, process chillers and handling equipment.
3. General services
Consumption from activities not directly connected to production: lighting, heating and cooling of the premises and of the administrative offices.
Where fitting a dedicated instrument is not worthwhile, consumption is derived by difference from the department’s main outgoing feeder, using virtual variables calculated on the gateway. The three areas always add up to the total measured on the main feeders
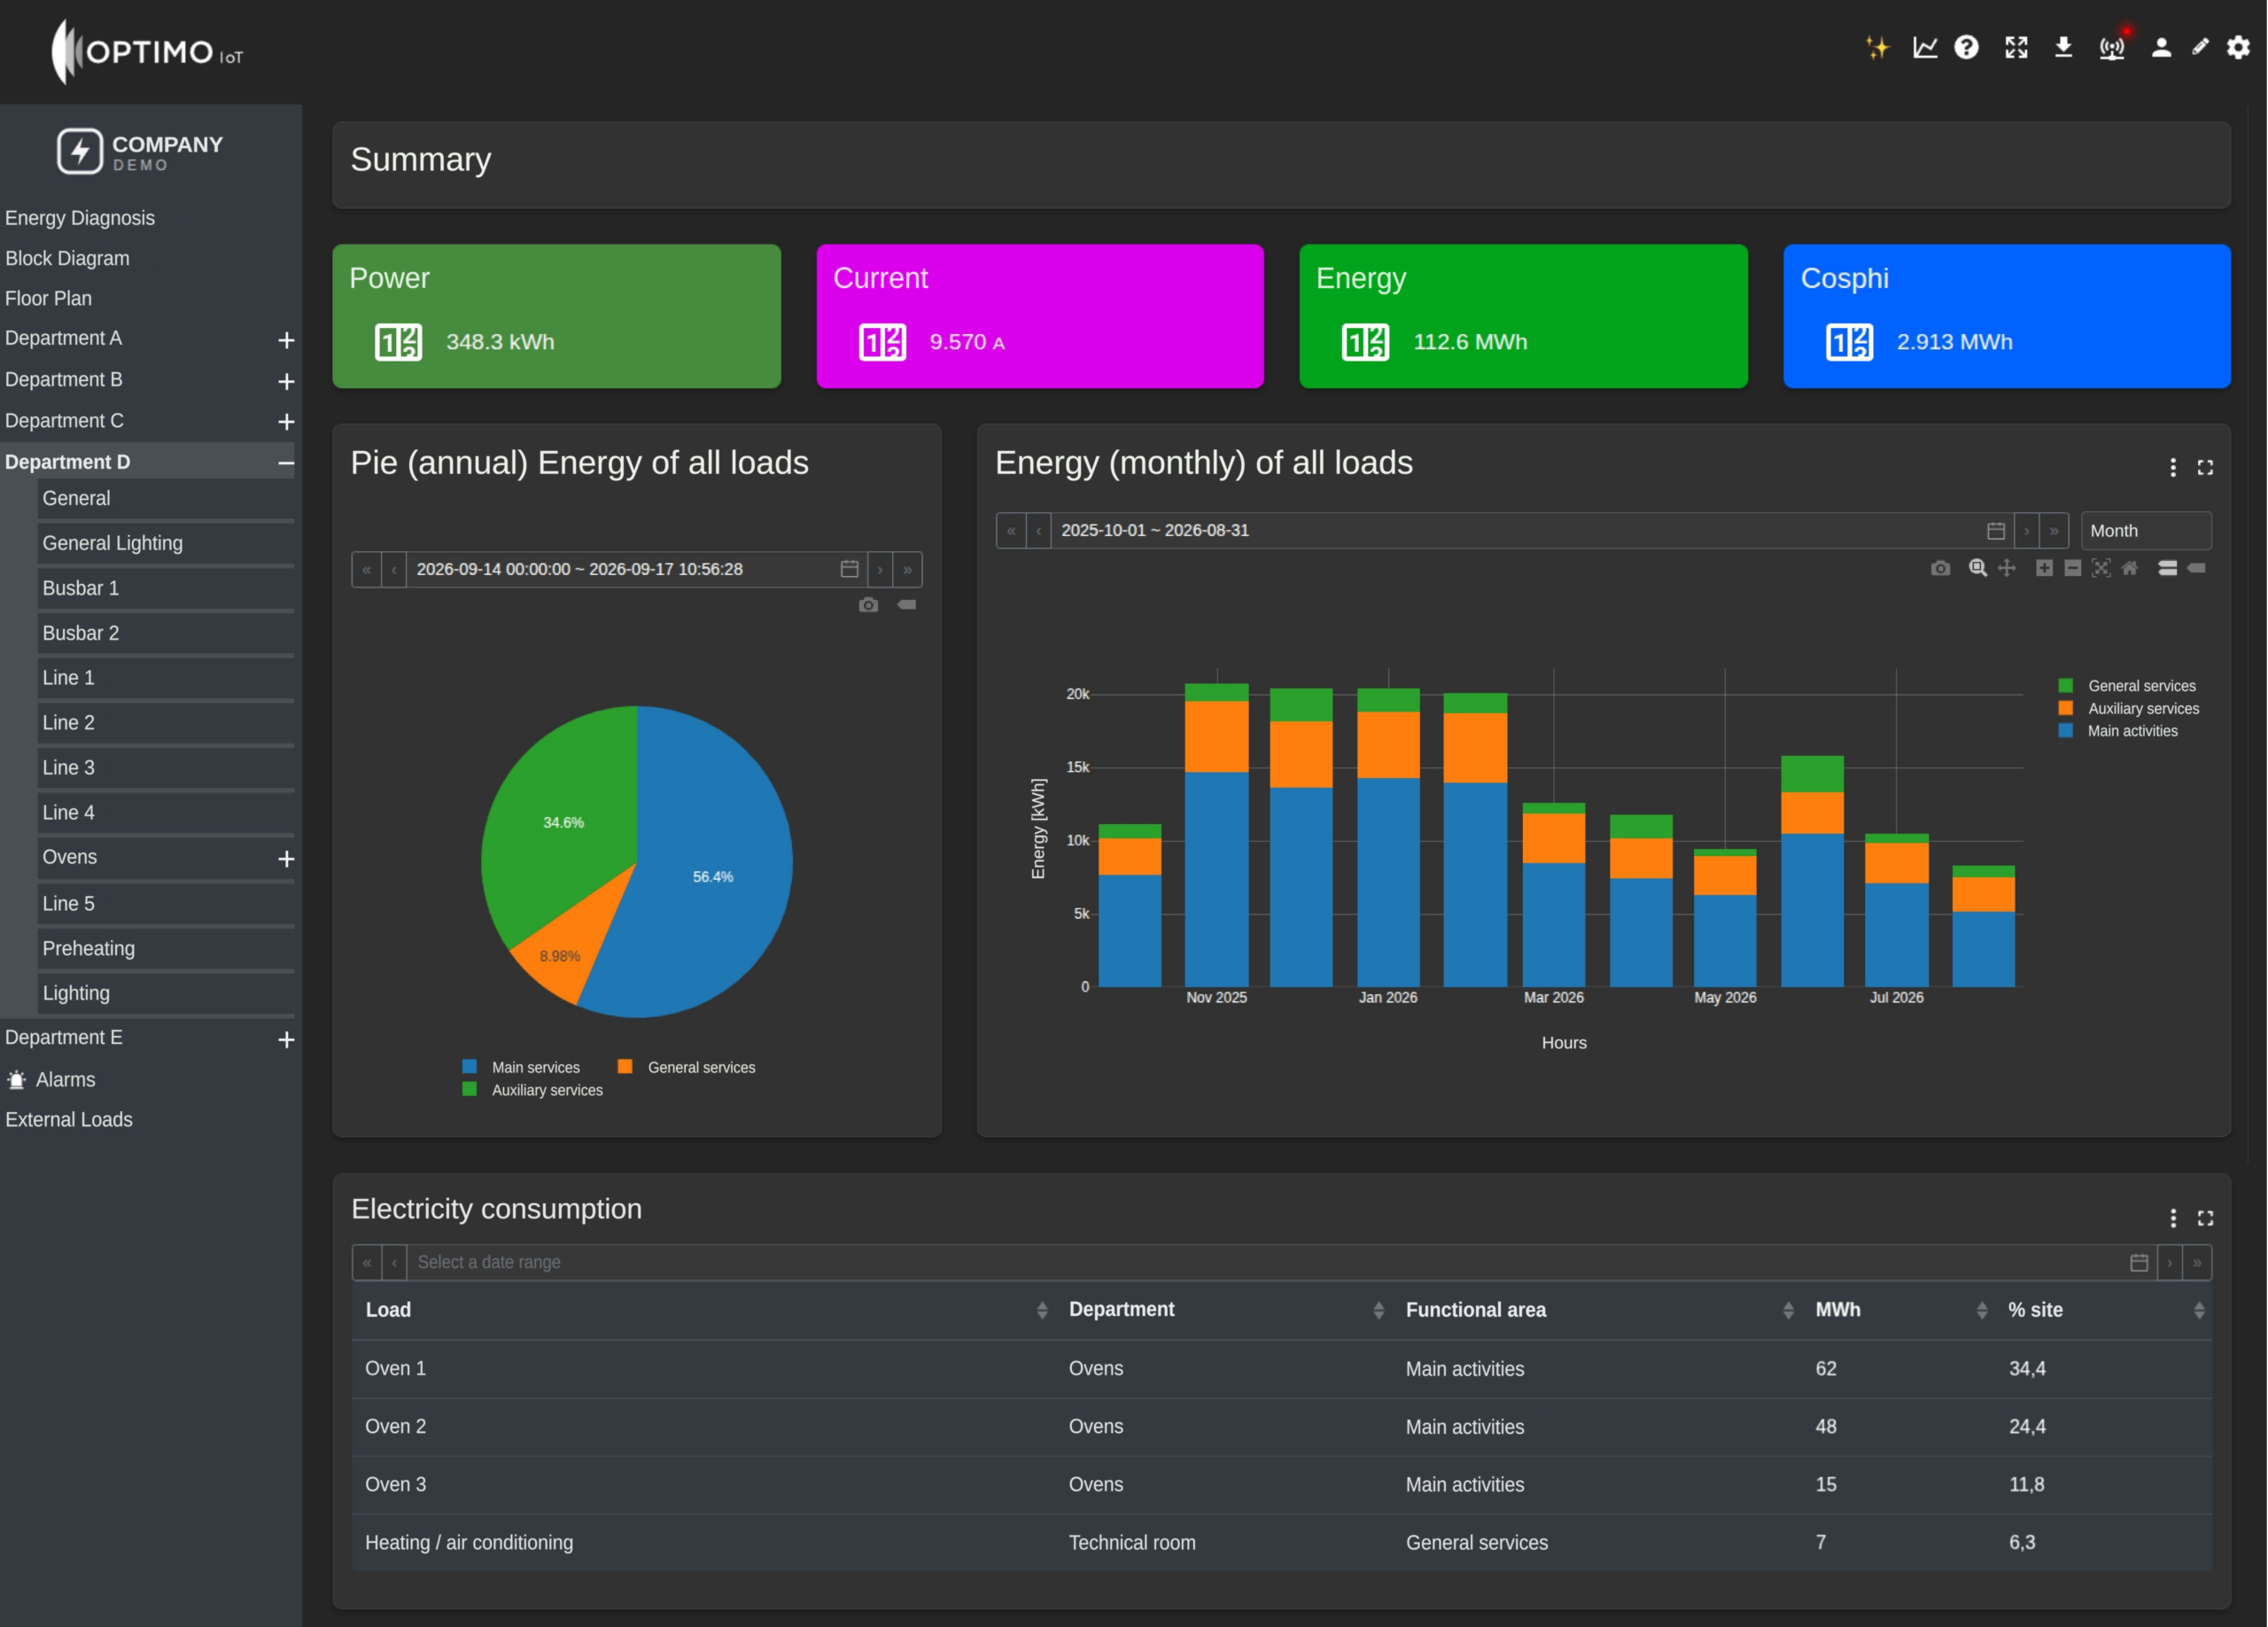
The breakdown, as you see it every day
The functional area aggregations are already configured. This is the dashboard the energy manager, the consultant and everyone else in the company logs into to look at consumption, export data to XLS, build periodic reports or run advanced analysis with AI tools through the Optimo IoT MCP connector
Four simple steps to build the system
Optimo IoT’s engineering expertise is what makes the difference: the measurement plan is defined and agreed before the instruments reach site. Optimo IoT supports the installer throughout the works.
1.
Site survey and preliminary design
A survey of the LV power centre and the departmental distribution boards: the outgoing feeders are identified, the rating plates read, the currents estimated and the space available in the cubicles checked. The result is a complete list of loads, with the type of measurement proposed for each and the functional area it belongs to.
2.
The measurement plan goes past the consultant
The list of measurement points and the breakdown across functional areas are validated with the consultant writing the audit, to check that the planned points meet the minimum monitoring percentages required by the ENEA Guidelines. This is the step that stops you discovering a missing measurement once everything is installed.
3.
Instruments in the panels, gateway in the substation
MID-certified meters with split-core current transformers on the individual feeders, power analysers with Rogowski coils on the risers of the MV/LV transformers, and the AL300 gateway in a dedicated panel in the substation plant room. The CTs are split-core: they are fitted without breaking the power conductors.
4.
Point-by-point checks and dashboard handover
Communication with every device is checked, the readings at each point verified and the dashboards functionally tested, with the functional area aggregations already configured. From that point the data is in the cloud and the customer can change the views themselves.
The components of the system
Measuring hardware in the panels, a gateway in the substation, the cloud platform. No software to install on company computers.
AssetLinker 300 IoT gateway
The heart of the system, installed where the site’s Ethernet ports can reach it. It reads the meters and the other equipment over Modbus RS-485 and Modbus TCP/IP and sends the data to the cloud.
Gateway panel
A dedicated panel with power supply, protection and isolation for the gateway. Supplied tested, with panel drawings and a declaration of conformity.
MID meters and split-core CTs
One meter per monitored load, with a set of three split-core current transformers sized to the feeder’s estimated current: 100 A, 200 A, 400 A, 600 A.
Power analysers with Rogowski coils
For measurements on the low-voltage risers of the MV/LV transformers, with Power Quality functions and installation that does not require dismantling the busbars.
Energy meters for steam lines and thermal circuits
Reading Endress+Hauser instrumentation, or that of other manufacturers, to bring in flow, power and energy from the steam lines and from the heating and cooling circuits serving the process. The Endress+Hauser Memograph data concentrator, for instance, connects to the AL300 gateway over Modbus
Flow meters for natural gas measurement
Measurement of the natural gas flow consumed by process loads: heat treatment furnaces and the like. If the line already has volumetric meters, it is enough to bring their pulse output into the Optimo IoT system. Where the measurement falls in a classified area, our engineering division assesses and sizes the ATEX safety chain required: barriers, pulse counters and the related accessories.
Flow meters for compressed air
Instantaneous and cumulative flow of the compressed air feeding the various lines: pick and place, pneumatic actuators, departmental loads. If you want to act on consumption, this is also the moment to consider instruments that optimise supply pressure to cut network losses, such as SMC’s AMS system.
Modbus RS-485 / TCP-IP converters
They bring onto the site Ethernet network the readings collected over serial Modbus RS485 from the meters in the departmental panels and from the gas and steam monitoring equipment along the production lines, avoiding the need to run new serial trunks back to the substation.
Node-RED licence
Calculation logic on the gateway: virtual variables, energy balances by difference, aggregation by functional area. This is what turns dozens of measurements into three readable numbers.
The data reaches the cloud over the site Ethernet network or, as an alternative or a backup, through the 4G module built into the AL300 gateway. No dependence on the company IT infrastructure, if you would rather avoid it.
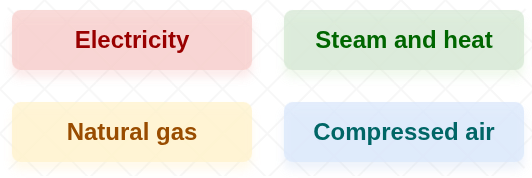
Adding an energy carrier does not mean rebuilding the system: the gateway, the licences and the platform stay the same; only the instrumentation downstream changes. The new variables join the same asset tree and the same functional area aggregations, and balances across carriers — electrical kWh per Nm³ of air, Sm³ of gas per tonne processed — become calculable with no further integration.
Download the brochure
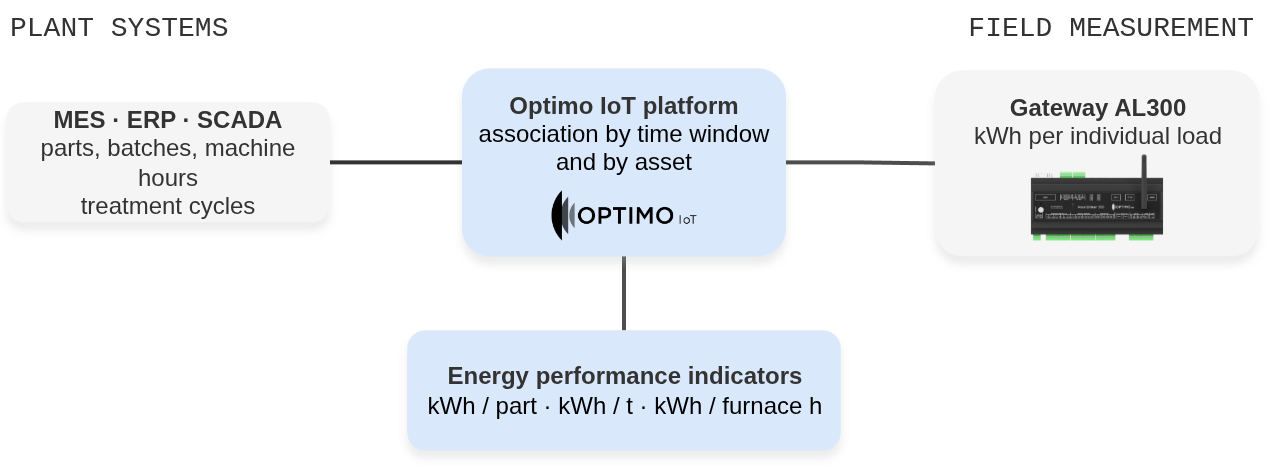
The consumption and production data needed to calculate EnPIs
An energy performance indicator is a ratio: kWh per piece produced, per tonne processed, per furnace hour. Monitoring provides the numerator. The denominator is in the MES.
FAQs
Is monitoring compulsory for an energy audit?
The ENEA Guidelines require the audit to rest on reliable consumption data and call for a monitoring plan with a minimum coverage of the loads. How that requirement is met, and exactly which measurement points are included, must be agreed with the consultant writing the audit: that is why we share the list of loads with them before going ahead.
How many measurement points does my site need?
It depends on how the electrical installation is arranged and on how consumption splits across the functional areas. The number is settled during the site survey, by looking at the outgoing feeders of the power centre and of the departmental panels. A medium-sized production site typically needs a few dozen measurement points; the plan is then validated with the consultant.
Does the plant have to be shut down to fit the instruments?
The current transformers specified are split-core, and Rogowski coils are used on the transformer risers, precisely to keep the downtime required to a minimum. The space available in the cubicles and the way the work will be carried out are checked during the preliminary survey.
Who carries out the installation?
Installation on site is carried out by the customer’s own electrical installer. Optimo IoT supplies the components, the design, the software configuration and the commissioning, during which the installer’s help is needed for the checks on site.
Can the data still be used after the audit?
Yes, and that is usually where the system pays for itself. Monitoring stays on: it verifies the savings from the measures the audit identified, checks the bills, catches consumption anomalies and prepares the next audit without starting from scratch.
Can I give my external consultant access to the data?
Yes. The platform can create user profiles with different levels of access, including view-only. The consultant reaches the data they need without being able to change the system configuration.
Can the system also monitor gas, steam, compressed air or water?
Yes, and that is how it was designed: the AL300 gateway reads any carrier, only the instrumentation downstream changes. Natural gas with pulse or Modbus volumetric meters and volume correctors; steam and superheated water by reading the Endress+Hauser process instrumentation already installed — vortex and Coriolis flow meters, pressure and temperature transmitters — or by adding new instruments; compressed air with flow meters and insertion flow meters on the mains. Thermal energy meters, water meters and photovoltaic inverters can be added too. Monitoring carriers other than electricity is not part of the base supply and is quoted separately, but it needs neither a new gateway nor a new platform.
Do I have to monitor every carrier straight away?
No, and in most cases it is not worth it. The recommended order is to start with electricity, the carrier with the most measurement points and the one the audit covers in most detail, and add the others as they are needed. The infrastructure installed for the first module — gateway, panel, connectivity, platform — serves all the later ones too, and those cost a fraction of the first.
Can I monitor more than one plant?
Yes, the platform is multi-site: several plants can be viewed and compared from a single interface, with the same functional area structure.
How often is the data sampled?
The sampling rate is set during configuration, typically every 5 minutes for energy quantities. Together with the number of variables it determines the volume of datapoints sent to the cloud, and therefore the size of the subscription fee.
At what granularity can I analyse the history?
Data can be aggregated over quarter-hour, hour, 8-hour, day, week, month and year intervals, with mean, sum, maximum, minimum, percentile, meter increment and weighted average functions.
Does the system qualify for the Italian iperammortamento relief?
The hardware and software components have characteristics consistent with the items in Annexes IV and V referred to by Italian Law 199/2025. Claiming the relief also requires interconnection with the company’s information systems, the technical dossier and a 4.0 appraisal by an independent third-party expert. Verifying that the requirements are met remains the responsibility of the Client and their advisers.
Is my company required to carry out an energy audit?
It depends on total annual energy consumption, no longer on the size of the company. Above 10 TJ (about 280 TOE) an energy audit and an Action Plan become compulsory; above 85 TJ (about 2,030 TOE) a certified ISO 50001 energy management system is required as well. Working out the total consumption and the corporate perimeter should be done with the appointed consultant or with an EGE.
What changes with the 2027 ISO 50001 obligation?
Above 85 TJ a year a periodic audit is no longer enough: a certified energy management system is required, which calls for a data collection plan with suitable, calibrated instruments (§ 6.6), an energy baseline, performance indicators and their periodic verification (§ 9.1). A permanent monitoring system covers these requirements directly. Anyone installing monitoring for the 2026 audit reaches the 2027 certification with the most demanding part already done.
Is monitoring also needed for energy performance indicators?
It is half the calculation. A performance indicator is a ratio between energy and activity: monitoring provides the numerator in kWh per individual load, while the denominator — pieces produced, tonnes processed, furnace hours — comes from the MES or the production management system. The system can be interconnected with those systems to pull the data automatically and calculate the indicators continuously.
How much does it cost?
The cost depends on the number of measurement points, on how the installation is arranged and on the installation work required. We carry out a preliminary survey, after which we provide the list of loads that can be monitored and a detailed quotation. On top of the supply there are the monthly cloud platform and AIMS service fees, invoiced separately.

Optimo IoT s.r.l.
via Francesco Restelli, 3
20124 Milan (MI) Italy
VAT no. 03834900130
Call us on +39 039 596 9780
Operational office: via Sant’Anna, 16 – 23875 Osnago (LC), Italy
Want to report a security issue? Get in touch